Great chart summarizing the strategies of those profiled in the book The Outsiders (LINK)
TED Talk - Nick Bostrom: What happens when our computers get smarter than we are? (LINK)
Related book (also a Bill Gates recommendation): Superintelligence: Paths, Dangers, StrategiesHow to Analyze a Business, the Sherlock Holmes Way (LINK)
Related book: A Few Lessons from Sherlock HolmesRay Dalio talks with Fareed Zakaria (video) [H/T ValueWalk] (LINK)
Book of the day: Now It Can Be Told
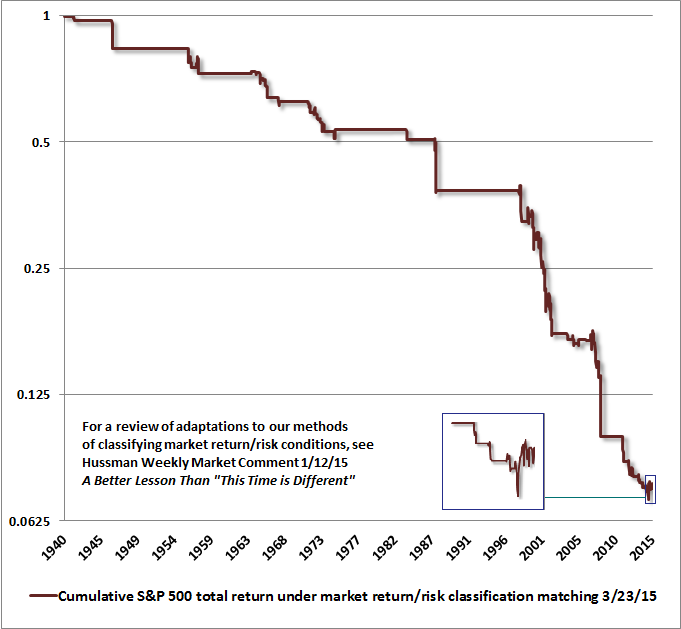
Hussman Weekly Market Comment: Fair Value on the S&P 500 Has Three Digits (LINK)
We continue to classify market conditions among the most hostile expected return/risk profiles we identify. The current profile joins rich valuations with continued evidence of a subtle shift toward risk aversion among investors, which we infer from market internals (a variant of what we used to call “trend uniformity”), credit spreads, and other risk-sensitive measures.
Liquidity in both the stock and bond markets is thinning considerably. In bonds, quantitative easing by global central banks has resulted in a scarcity of available collateral, a collapse in repo liquidity, and increasing frequency of delivery failures, all of which is shorthand for a bond market that is becoming less liquid and more fragile to any credit event. Meanwhile, risk premiums are minuscule. Avoiding a negative total return on 10-year bonds now requires that interest rates must not rise by even one percentage point over the next three years. Bond yields have historically covered investors against a meaningful change in yields before resulting in negative total returns. On a one-year return horizon, bond yields presently cover investors for a yield change amounting to only about 0.25 standard deviations – matching mid-2012 as the lowest level of yield coverage in history.
.....
Last week, the Nasdaq Composite finally clawed its way to breakeven, 15 years after its spectacular bubble peak in 2000. It’s a testament to the overvaluation of technology stocks in 2000 that it has required the third equity bubble in 15 years to reclaim that 2000 high, at least briefly. As you may remember, the Nasdaq Composite reached its intra-day high of 5132.52 in March 2000, plunging to 795.25 (down -78%) by October 2002. The Nasdaq 100, representing the most glamourous of the group, peaked at 4816.25 in March 2000, plunging to 795.25 (down 83%) by October 2002. Even a decade later, in 2010, both indices were still 60-65% below their 2000 highs. The 2000-2002 decline also took the S&P 500 down by half, wiping out the entire total return of the S&P 500 – in excess of Treasury bill returns – all the way back to May 1996.
.....
On the basis of valuation measures best correlated with actual subsequent market returns, we can say with a strong degree of confidence that the S&P 500 would presently have to drop to the 940 level in order for investors to expect a historically normal 10-year total return of 10% annually. That 940 figure for the S&P 500 would not represent some extreme, catastrophic outcome. It’s not a level that would even represent undervaluation from a historical perspective. It’s the level that we would associate with average, historically run-of-the-mill long-term equity returns. As we observed at the 2000 peak, “if you understand values and market history, you know we’re not joking.”
That said, if one believes that depressed interest rates warrant not only a low prospective return on stocks, but also virtually no risk premium whatsoever despite their significant full-cycle volatility, then you might be quite happy with the prospect of a 1.4% annual nominal total return on the S&P 500 over the coming decade, which is what we presently estimate from current levels, based on a variety of historically reliable methods (see Ockham’s Razor and the Market Cycle for the arithmetic behind these estimates). In that case, you might consider stocks to be "fairly valued" here. But you should still allow for a 940 level or below on the S&P 500 over the completion of this market cycle.
One might think that low interest rates would preclude the possibility of the market losing more than half of its value, but historically, one would be wrong. Outside of the inflation-disinflation cycle from the mid-1960’s to the mid-1990’s, the historical correlation between 10-year Treasury yields and 10-year prospective stock returns has been far weaker than investors seem to believe. Indeed, except for the 2000-2002 cycle, the final low that completes a market cycle has historically taken the market well below run-of-the-mill valuation norms, even in periods prior to the mid-1960’s when interest rates were similarly low and much more stable. One might think that Fed easing would preclude that possibility, until you realize that the Fed was easing aggressively and continuously throughout the 2000-2002 and 2007-2009 collapses.