A Dozen Things Learned from Mario Gabelli about Investing and Business (LINK)
Amazon Expands Prime With Goods Shipped Directly From Merchants (LINK)
How Wall Street Enabled A Controversial Power Grab At A Wannabe Berkshire Hathaway [H/T Linc] (LINK)
The Leithner Letter Leithner Letter No. 188-191 (LINK)
Introductory chapter of John Kay's forthcoming book, Other People's Money (LINK)
What advances in robotics and AI bode for us (video) [H/T @danielpink] (LINK)
Philae comet lander wakes up and phones home (LINK)
Another Paul Jaminet interview discussing his book, Perfect Health Diet (LINK)
Hussman Weekly Market Comment: When You Look Back On This Moment In History (LINK)
There are moments in time when durable history is made; history that others observe much later, shaking their heads, at a loss to understand how the events that followed could not have been obvious at the time. When you look back on this moment in history, remember these things.
When you look back on this moment in history, remember that spectacular extremes in reliable valuation measures already told you how the story would end. Among the measures best correlated with actual subsequent S&P 500 total returns, capitalization-weighted market indices such as the S&P 500 were more richly valued in only 54 weeks of history, 21 of which represented the final advance to the 2000 market peak, with the remaining 33 representing the retreat from that high to present valuation levels, on the way to a 50% loss in the S&P 500 Index and an 83% loss in the Nasdaq 100 Index. Presently, the market has already lost the momentum and favorable market internals that were evident during that final run, so we doubt that the 2000 extreme should be viewed as an objective.
...
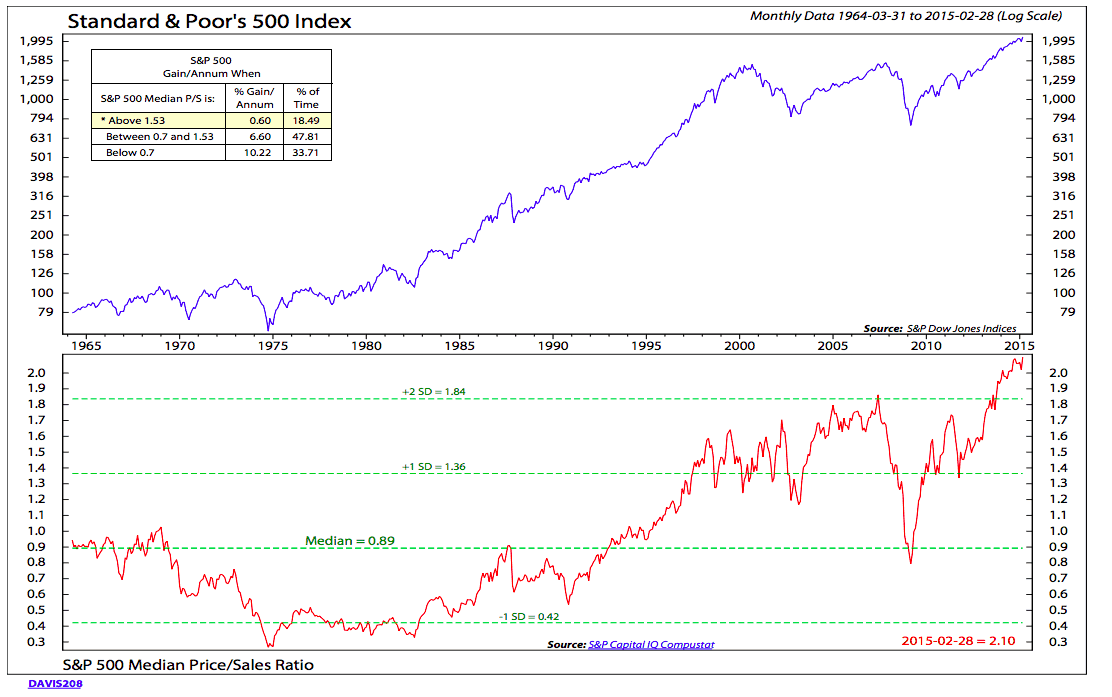
When you look back on this moment in history, remember that the valuation of the median stock was never higher. Ever. Even at the 2000 peak.
As we’ve noted previously, MarketCap/GVA has a correlation of about 92% with actual subsequent 10-year S&P 500 total returns, even in recent market cycles. Look carefully at the chart above, and notice thatsecular valuation lows such as 1950 and 1982 occurred at valuation levels just one quarter of current levels. Forget, for a moment, about the next 5 years, 10 years, or even 15 years. Suppose that the market was to experience a secular low no sooner than 20 years from today. What would the total return of the S&P 500 be in the interim? Well, we know that earnings, revenues, and nominal GDP have historically proceeded at a peak-to-peak growth rate of 6% annually across economic cycles. That growth rate has been gradually slowing in recent decades, and there are strong reasons beyond inflation – rooted in labor force growth and real productivity growth – to be more conservative. But suppose, as optimists, we assume the same 6% nominal growth rate in the future. In that case, the percentage change in the S&P 500 over the 20 year period to that secular low would be (1.06)*(1/4)^(1/20)-1 = a loss of -1.1% annually. Fortunately, one would expect dividend yields to contribute enough to bring the total return of the S&P 500 just above zero.
You can understand market returns over every span of history using the same basic arithmetic. In the 33 years since the 1982 low, valuations have quadrupled, and the S&P 500 has enjoyed an average price increase of 9.5% annually, even though nonfinancial gross value added has increased by only 5% annually. Do the math: (1.05)*(4/1)^(1/33)-1 = 9.5%. Kick in the average 2.8% dividend yield since 1982, and you arrive at the 33-year total return since 1982 of 12.3% annually. Understand how much of that long-term return is owed to depressed starting valuations.